As part of my Internet History, Technology, and Security course on Coursera I did a demographics survey and received 4701 responses from my students.
I will publish all the data in a recorded lecture summarizing the class, but I wanted to give a sneak preview of some of the geographic data results because the Python code to retrieve the data was fun to build. Click on each image to play with a zoomable map of the visualized data in a new window. At the end of the post, I describe how the data was gathered, processed and visualized.
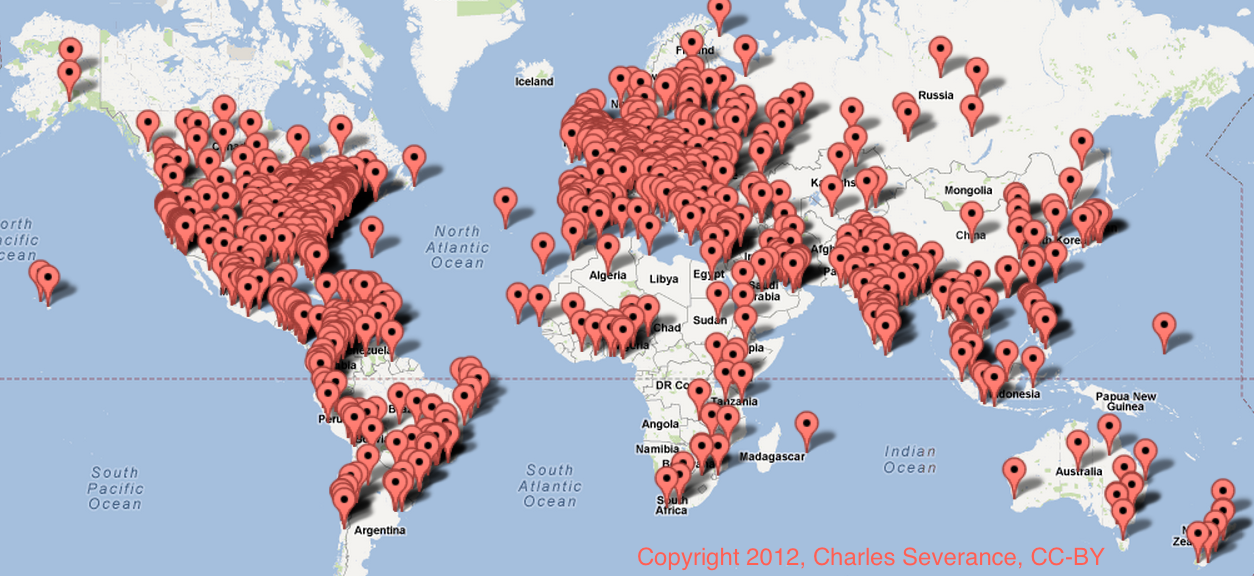
Where are you taking the class from (State/Country)?
If you went to college or are currently going to college, what is the name of your college or university?
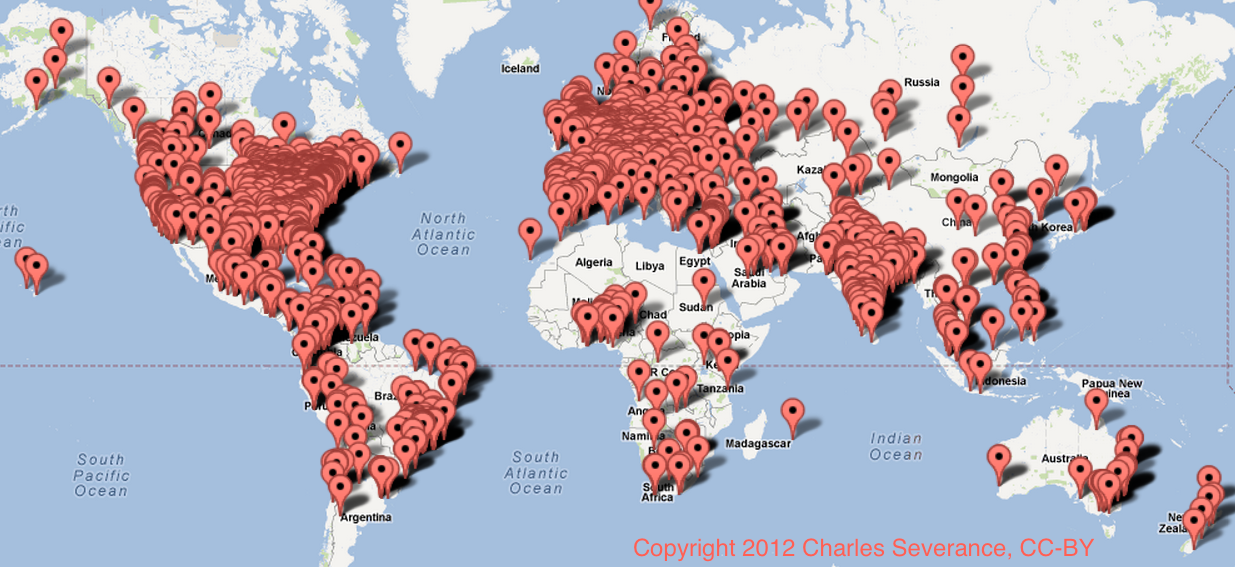
The second graph is naturally more detailed as the first question asked them to reduce their answer to a state versus the second question asking about a particular university. The data is noisy because it is all based on user-entered data with no human cleanup.
Gathering the data
Both fields were open-ended (i.e. the user was not picking from a drop-down). I had no idea how I would ever clean up the data, and when I got 4701 responses, I figured I would just take a look around and realized that my students were from a lot of places. On a lark Friday morning I started looking for the Yahoo! Geocoding API that I had heard about several years ago at a Yahoo! hackathon on the UM campus where I met Rasmus Lerdorf – the inventor of PHP. I was disappointed to find out that Y! was out of the geocoding business because it sounded cool. But I was pleased to find Google’s Geocoding API looked like it provided the same functionality and was available and easy to use.
So I set out to write a spider in Python that would go though the user-entered data and submit it to the geo-coder lookup API and retrieve the results. I used a local SQLite3 database to make sure that I only looked up the same string once. I had two data sets with nearly 6000 items total and the Google API stops you after 2500 queries in a 24 hour period. So it took three days to get the data all geocoded.
I did not clean up the data at all – I just submitted the user-entered text to Google’s API and took back what it said. Then I used Google’s Maps API for Javascript to produce the zoomable maps.
If you are curious about the nature of the spider, I adapted the code from the sample code in chapters 12-14 in my Python for Informatics textbook.