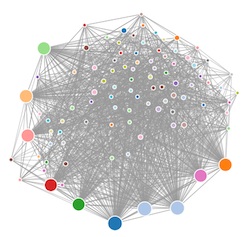
 I have been hacking up some sample code for my SI301 course the past few weeks. The course is about Networks, Crowds ,and Markets and so I wanted to build a rudimentary Python web crawler that would retrieve a web site, run a page rank algorithm on it, and then visualize the page rank and the links.
If you click on the image, you will see an interactive version of the visualization and be able to play with the visualization of some pages on www.sakaiproject.org. You can hover over a node to see the URL, or click and drag a node around, or double click on a node to launch the actual web page.
Here is the Source code in Python.
It uses the completely cool D3 Data Driven Documents to perform the visualization.
Comments/bug fixes welcome.