I am preparing for my Data Mining/Social Networking course next semester (SI301) and of course the main project will be about analyzing Sakai activities as a developer community and social community. Of course visualization will be a big part of the course activity.
So I got a head start and played with some data from commit logs. Because I was not aware of the xml output from svn -log (thanks Seth) – I did this by screen scraping ViewSVN at source.sakaiproject.org. I scraped all the commits in the main SVN and Contrib into some SQLite3 databases. The databases allowed me to restart the process if it croaked. It took about a day and I ended up with 540 MB of data. Then I ran a process to parse and categorize the data – that process read all 540MB and produced a nice, normalized database of 3MB in about 20 minutes.
After I had my nice 3MB database, I wrote some Python+Sqlite3 scripts to grock, and accumulate the data various ways. The work is still in draft form.
http://www-personal.umich.edu/~csev/sakai/data/
There are five graphs – the most fun one is the movement graph including both the main SVN and Contrib. Hint: To make it visually more fun follow these hints: (1) Change from “Same Color” to “Unique Colors”, (2) Change from “Same Size” to “Cumulative”, and (3) Experiment switching from Linear to Log scale to make it more exciting, (4) hover over a data point to see who it represents, and (5) you can click on a data point and then replay the data to make it have a “trail”.
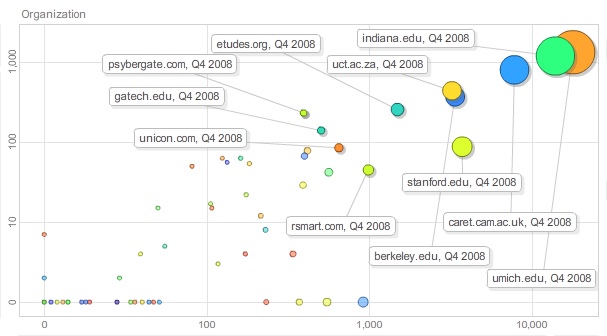
This is all pretty cool and it uses the Google Vizualization API which does all the work in Flash/Javascript.